GoHighLevel’s New Reporting Dashboard: What It Fixes and How to Set It Up
What’s New in the Dashboard
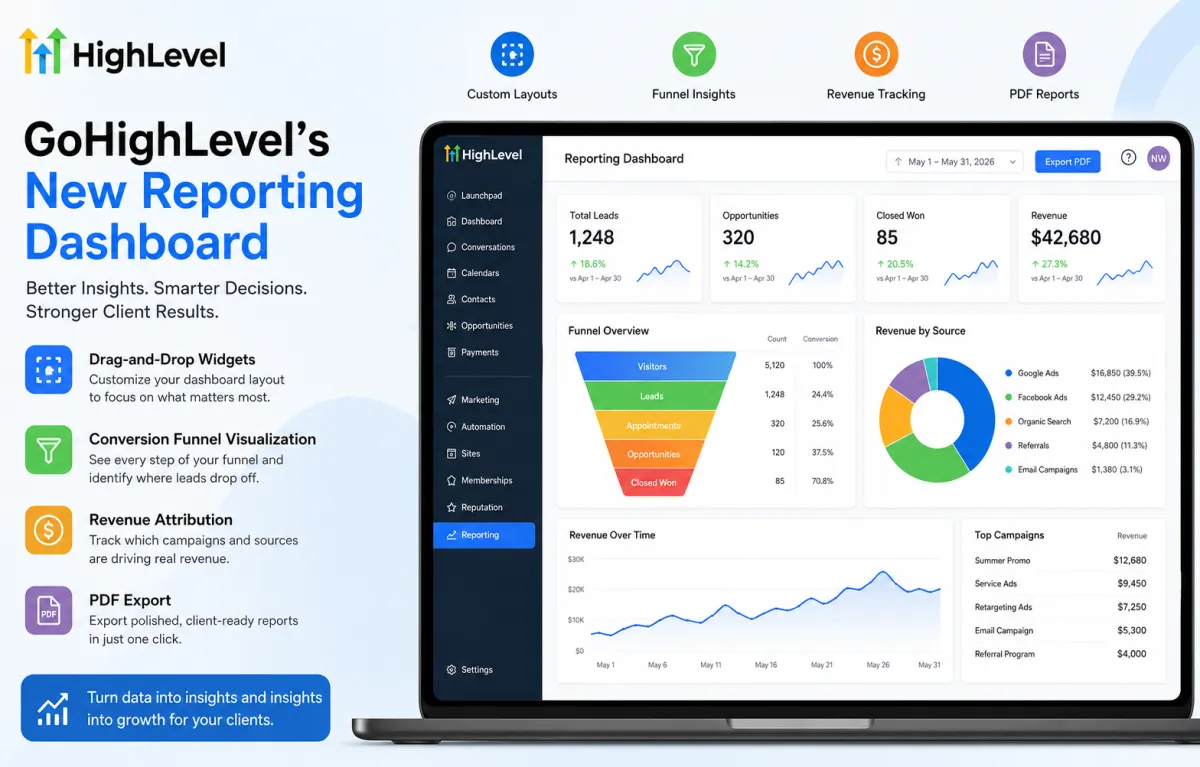
•Drag-and-drop widget layout, replacing a more rigid, fixed reporting structure
•Conversion funnel visualization, showing where leads drop off across a pipeline rather than just raw totals
•Revenue attribution, connecting specific campaigns or sources to actual closed revenue rather than just lead volume
•PDF export, making it far easier to hand a client a clean, branded report without manually rebuilding one in another tool
Why This Matters for Client Retention
Clients who can’t clearly see what an agency is actually delivering are far more likely to question the value of the relationship, regardless of how well the underlying work is actually going. A reporting dashboard that’s genuinely easy to read and easy to export as a professional PDF removes one of the most common friction points in monthly client check-ins.
How to Set Up a Client-Ready Report
1.Identify the 3–5 metrics that actually matter to each specific client’s goals, rather than defaulting to every available widget.
2.Build the funnel visualization around the client’s actual sales stages so the drop-off points reflect their real process, not a generic template.
3.Set up revenue attribution against the specific campaigns or channels the client cares most about, so the report answers ‘was this worth it’ directly.
4.Standardize a dashboard template for each service package you offer, so building a new client’s report doesn’t start from scratch every time.
Turning Reporting Into a Retention Tool
Beyond just presenting data, a strong reporting cadence sent proactively rather than only when a client asks signals that an agency is actively watching results rather than passively running campaigns. Pairing the new dashboard with a consistent monthly (or even biweekly) send cadence turns reporting from an obligation into a relationship-building touchpoint.
Frequently Asked Questions
Can clients access the dashboard directly, or only receive exported PDFs?
Both options are generally available agencies can grant client-level dashboard access for real-time visibility, or rely on scheduled PDF exports for a more controlled, curated reporting experience.
Does setting up the new dashboard require rebuilding old reports from scratch?
Existing reporting setups may need to be reconfigured to take advantage of the new widget layout and attribution features, though this is generally a configuration update rather than a full rebuild.
Is revenue attribution accurate for all lead sources?
Attribution accuracy depends on how consistently lead sources and campaigns are tagged within the account clean tagging practices going forward will make attribution data more reliable.
Making Reporting Work For You, Not Against You
A better dashboard only helps if it’s actually configured around what each client cares about otherwise it’s just a more attractive version of the same generic report. NextGen Wizards builds standardized, client-specific dashboard templates using GoHighLevel’s new reporting tools, so agencies can roll out professional reporting without building each one manually.
A Sample Dashboard Layout by Client Type
Local Service Business
Lead volume by source, call answer rate, appointment booking rate, and job value by lead source these four widgets answer the question ‘is marketing spend turning into paid jobs’ more directly than a generic lead-count report.
E-Commerce or Retail
Revenue attribution by campaign, cart abandonment recovery rate, average order value trend, and repeat purchase rate prioritizing revenue outcomes over top-of-funnel vanity metrics.
Professional Services (legal, medical, financial)
Consultation booking rate, funnel drop-off by stage, and lead source quality (not just volume) since these clients often care more about lead quality and conversion than raw lead count.
Common Reporting Mistakes This Update Helps Fix
1.Sending clients raw lead counts without any indication of what happened to those leads afterward the funnel visualization directly addresses this.
2.Building a different manual report structure for every client, which makes it hard to standardize your agency’s own internal process the drag-and-drop widget system makes a repeatable template far easier to maintain.
3.Only reporting monthly, when a lighter, faster-to-produce PDF export makes a biweekly or even weekly summary realistic without a large time cost per client.
Rolling This Out Across an Existing Client Base
Rather than rebuilding every client’s reporting individually, start by identifying 2–3 dashboard templates that cover the majority of your client types (e.g., local service, e-commerce, professional services), then customize only the details that genuinely differ per client specific goals, specific campaigns, specific branding. This keeps the rollout fast without sacrificing the sense that each report was built specifically for that client.